Track Revenue and Brokerage
This report answers the money questions: how much value the team is closing, and where your brokerage stands. You'll see sales and rent value over time alongside commission grouped by status, so what's still open is easy to chase.
Entry pointReports → Sales
| Article summary | Details |
|---|---|
| Best for | Managers tracking revenue and brokerage |
| Main outcome | A read on closed value and commission status |
| Roles | Manager, admin |
| Requires | Permission to view Reports; deals with values |
| Related reports | Project Report, Agent Activity |
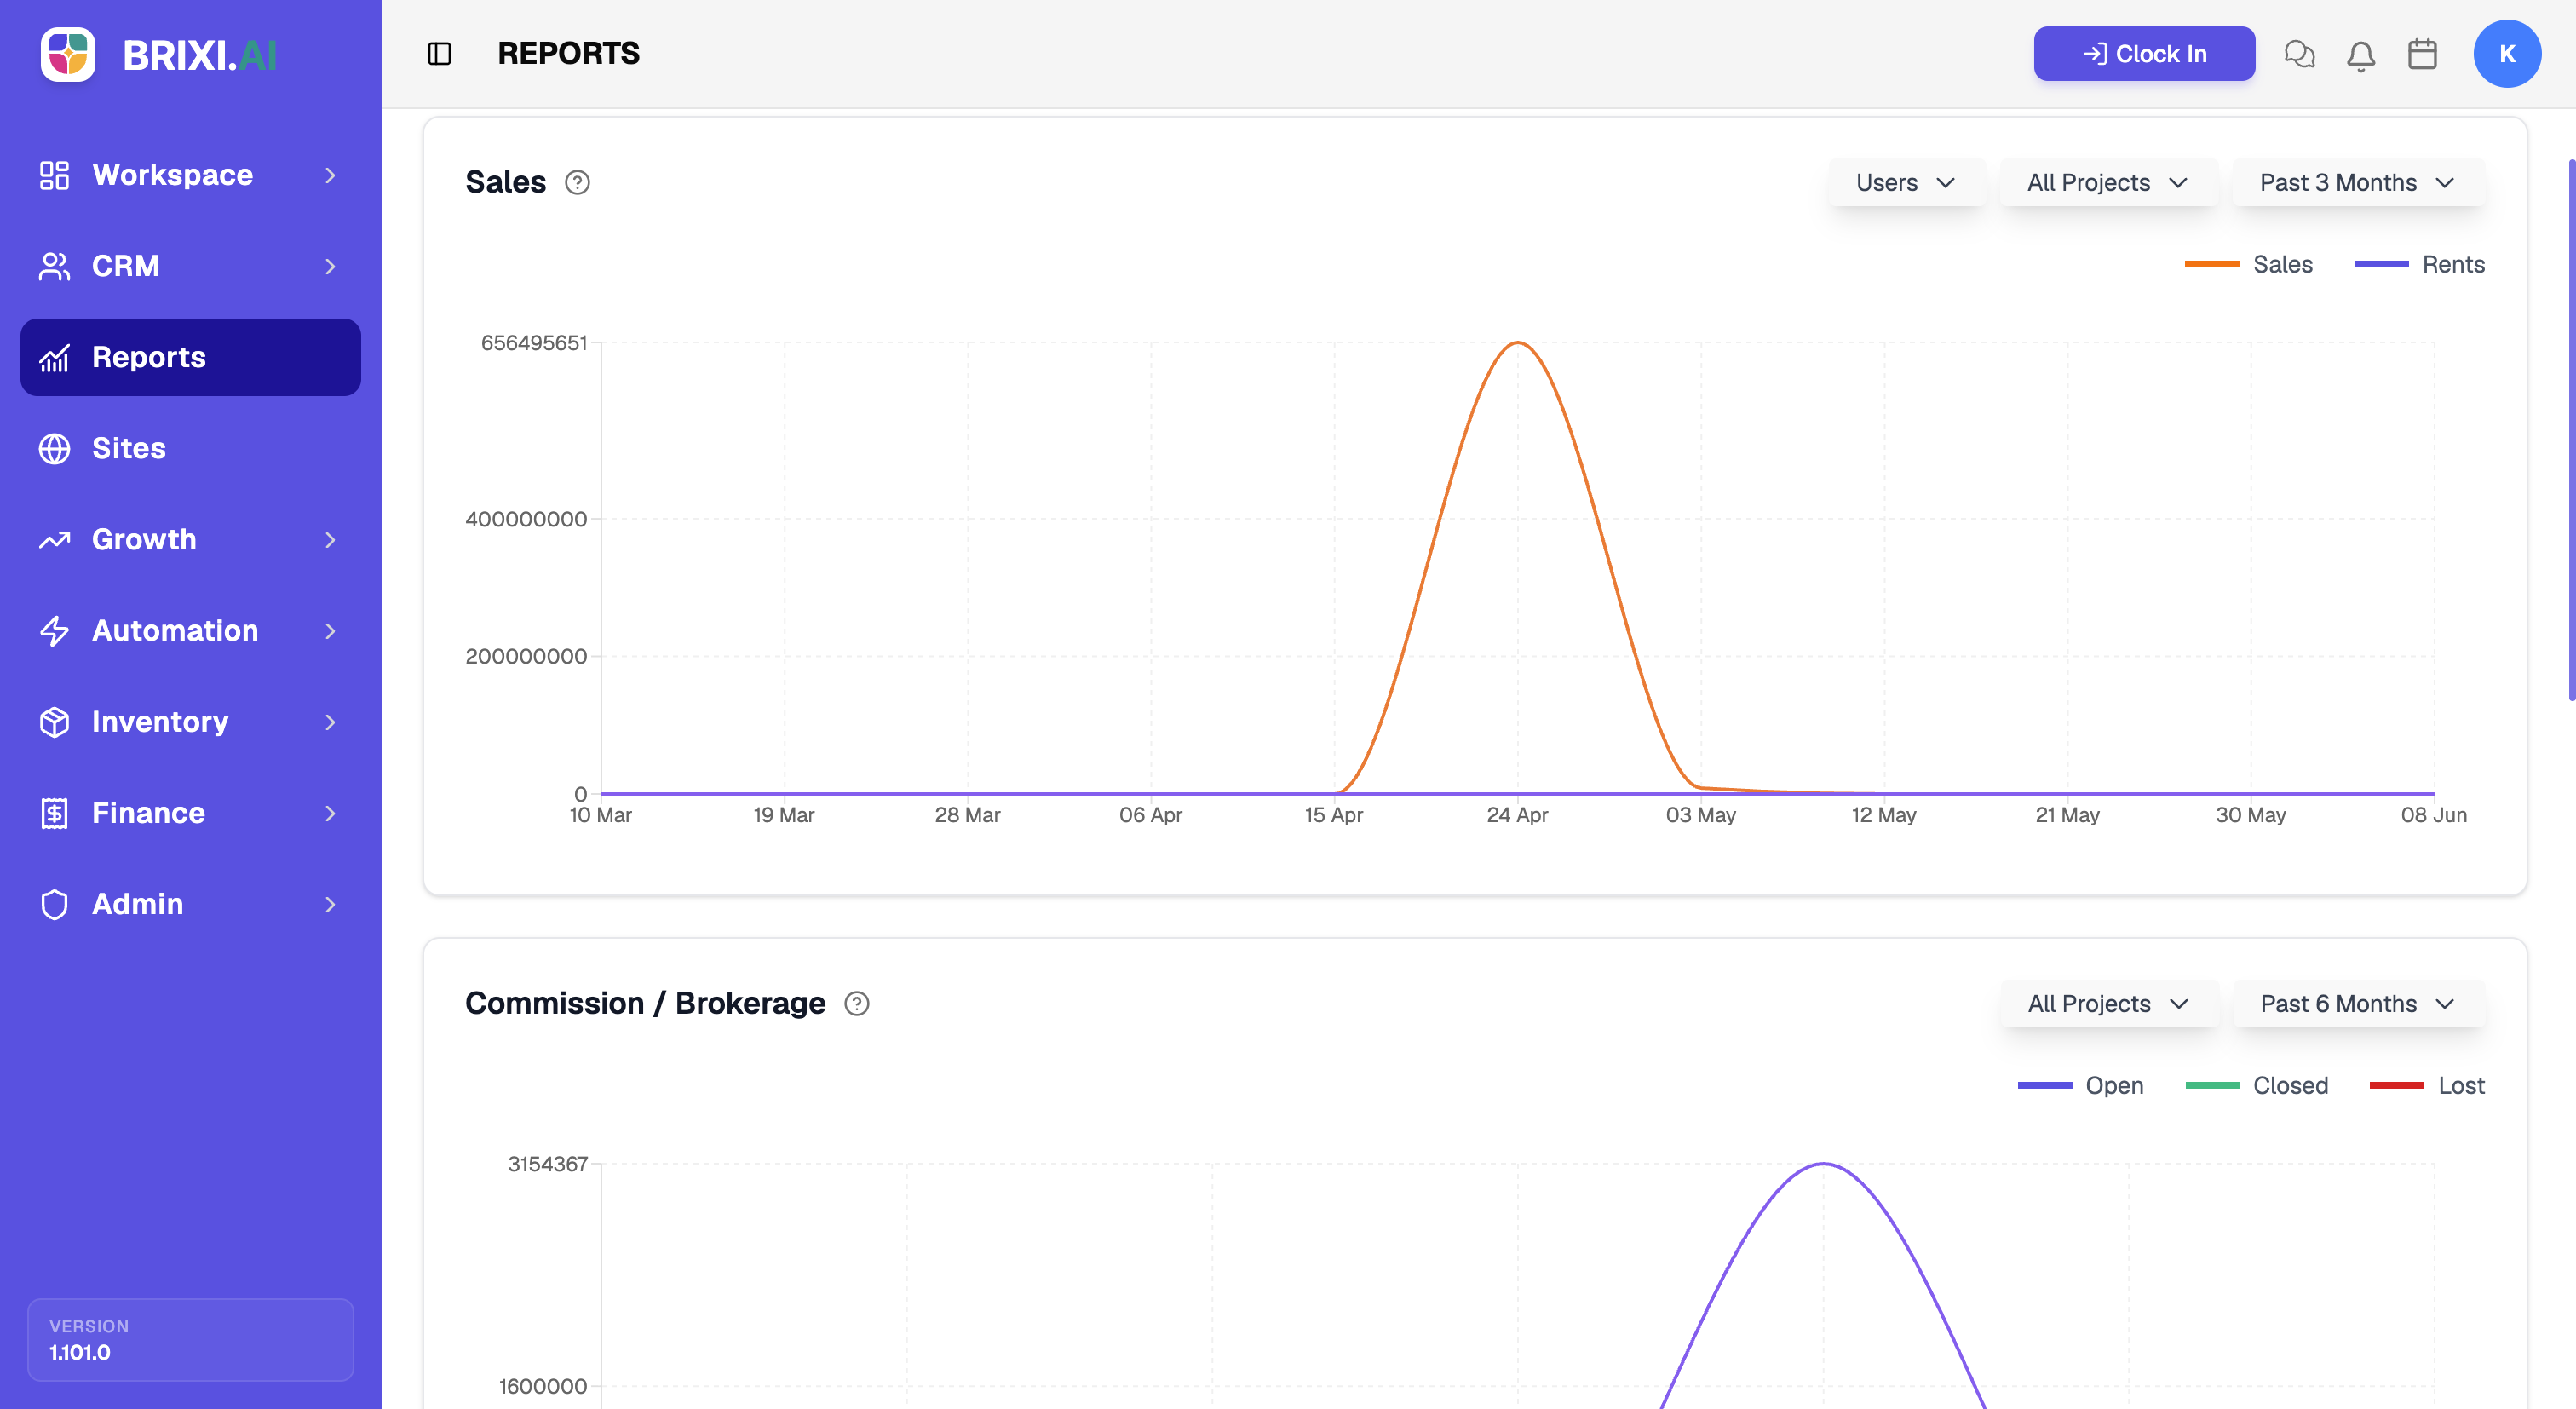
What It Shows
| Section | What it tells you |
|---|---|
| Sales chart | Sales and Rents value over the selected period |
| Commission / Brokerage | Brokerage grouped by status — Open, Closed, and Lost |
Before You Start
Narrow the view with the Users, All Projects, and period filters before drawing conclusions — team-wide totals hide a lot.
How To Read It
- Open Reports → Sales.
- Read the Sales chart to track sales and rent value over time.
- Read Commission / Brokerage to see how much brokerage is open, closed, or lost.
- Filter by user or project to attribute revenue.
Common Issues
| Issue | What to check |
|---|---|
| Sales value looks low | Confirm deals carry values and are in the right stage |
| Brokerage is missing | Confirm commission is recorded on the deals |
Ask your admin if the Sales tab is hidden — revenue reporting is often restricted more tightly than other tabs. Low-looking figures are usually deals missing values or commission, which the deal owners should fix.
If the figures still disagree with deals that clearly carry the right values, contact Brixi support with the period, the filters, and a screenshot.
Reporting Impact
Revenue here is whatever your deals say it is. A deal closed without a value, or commission never recorded, leaves a hole in the chart that no filter can fix.