Reports & Analytics
Everything you measure lives here: where leads come from, how inventory moves, how active each agent is, and how the team performs. Each report filters by period and, where it makes sense, by user or project — so you can see where to coach, where to invest, and what's working.
Entry pointReports
Reports are organized into tabs across the top, and most views can be exported.
Report Tabs
| Tab | What it shows |
|---|---|
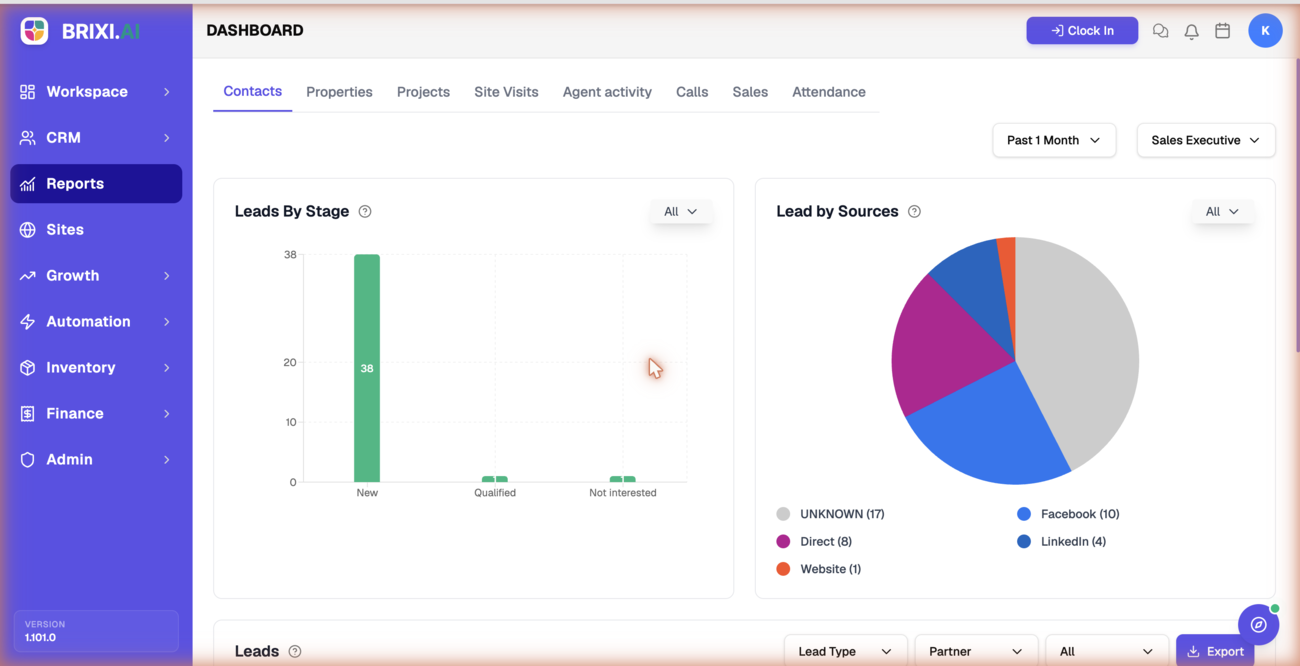
| Contacts | Leads by stage and lead sources, plus a filterable leads table |
| Properties | Listing counts by Sale and Rent, and property enquiries |
| Projects | Total sale and rent per project, with a project performance table |
| Site Visits | Appointment totals (completed, scheduled, cancelled) and trends |
| Agent activity | Per-agent statistics and an engagement table |
| Calls | Calls made and received, and per-agent call activity |
| Sales | Sales and rent value over time, plus commission and brokerage |
| Attendance | Present, leave, and daily attendance for the team |
Common Controls
| Control | What it does |
|---|---|
| Period (e.g. Past 1 Month) | Sets the date range for the charts and tables |
| Users / Sales Executive | Narrows a report to a person or team |
| Project / City / Locality | Narrows property and project reports |
| Export | Downloads the report data, where available |
Before You Start
- Confirm your role can view Reports. Some teams limit reporting to managers and admins.
- Pick the right period first — every chart and table reflects it.
- Remember that reports read from your live data: clean ownership, stages, sources, and statuses make every report more accurate.
Reporting Impact
Reports don't change records; they summarize them. Each one is only as good as the data behind it — how consistently the team captures stages, sources, owners, call logs, site visits, and attendance.
Troubleshooting
If the Reports area or one of its tabs is missing, that's a role question — many teams limit reporting to managers and admins, so ask yours which tabs your role can see.
Support comes in when a report misbehaves: a chart that won't load, or a total that clearly contradicts the records underneath it. Tell them which tab, which filters you had applied, and attach a screenshot.