See Which Inventory Is in Demand
This report shows how your inventory splits between sale and rent, and how many enquiries your listings are pulling. It's the quickest way to spot which stock is in demand and which is sitting idle — useful when you're deciding what to push and what to source more of.
Entry pointReports → Properties
| Article summary | Details |
|---|---|
| Best for | Managers tracking inventory demand |
| Main outcome | A read on listing mix and enquiry volume |
| Roles | Manager, admin |
| Requires | Permission to view Reports; listings in Inventory |
| Related reports | Project Report, Sales |
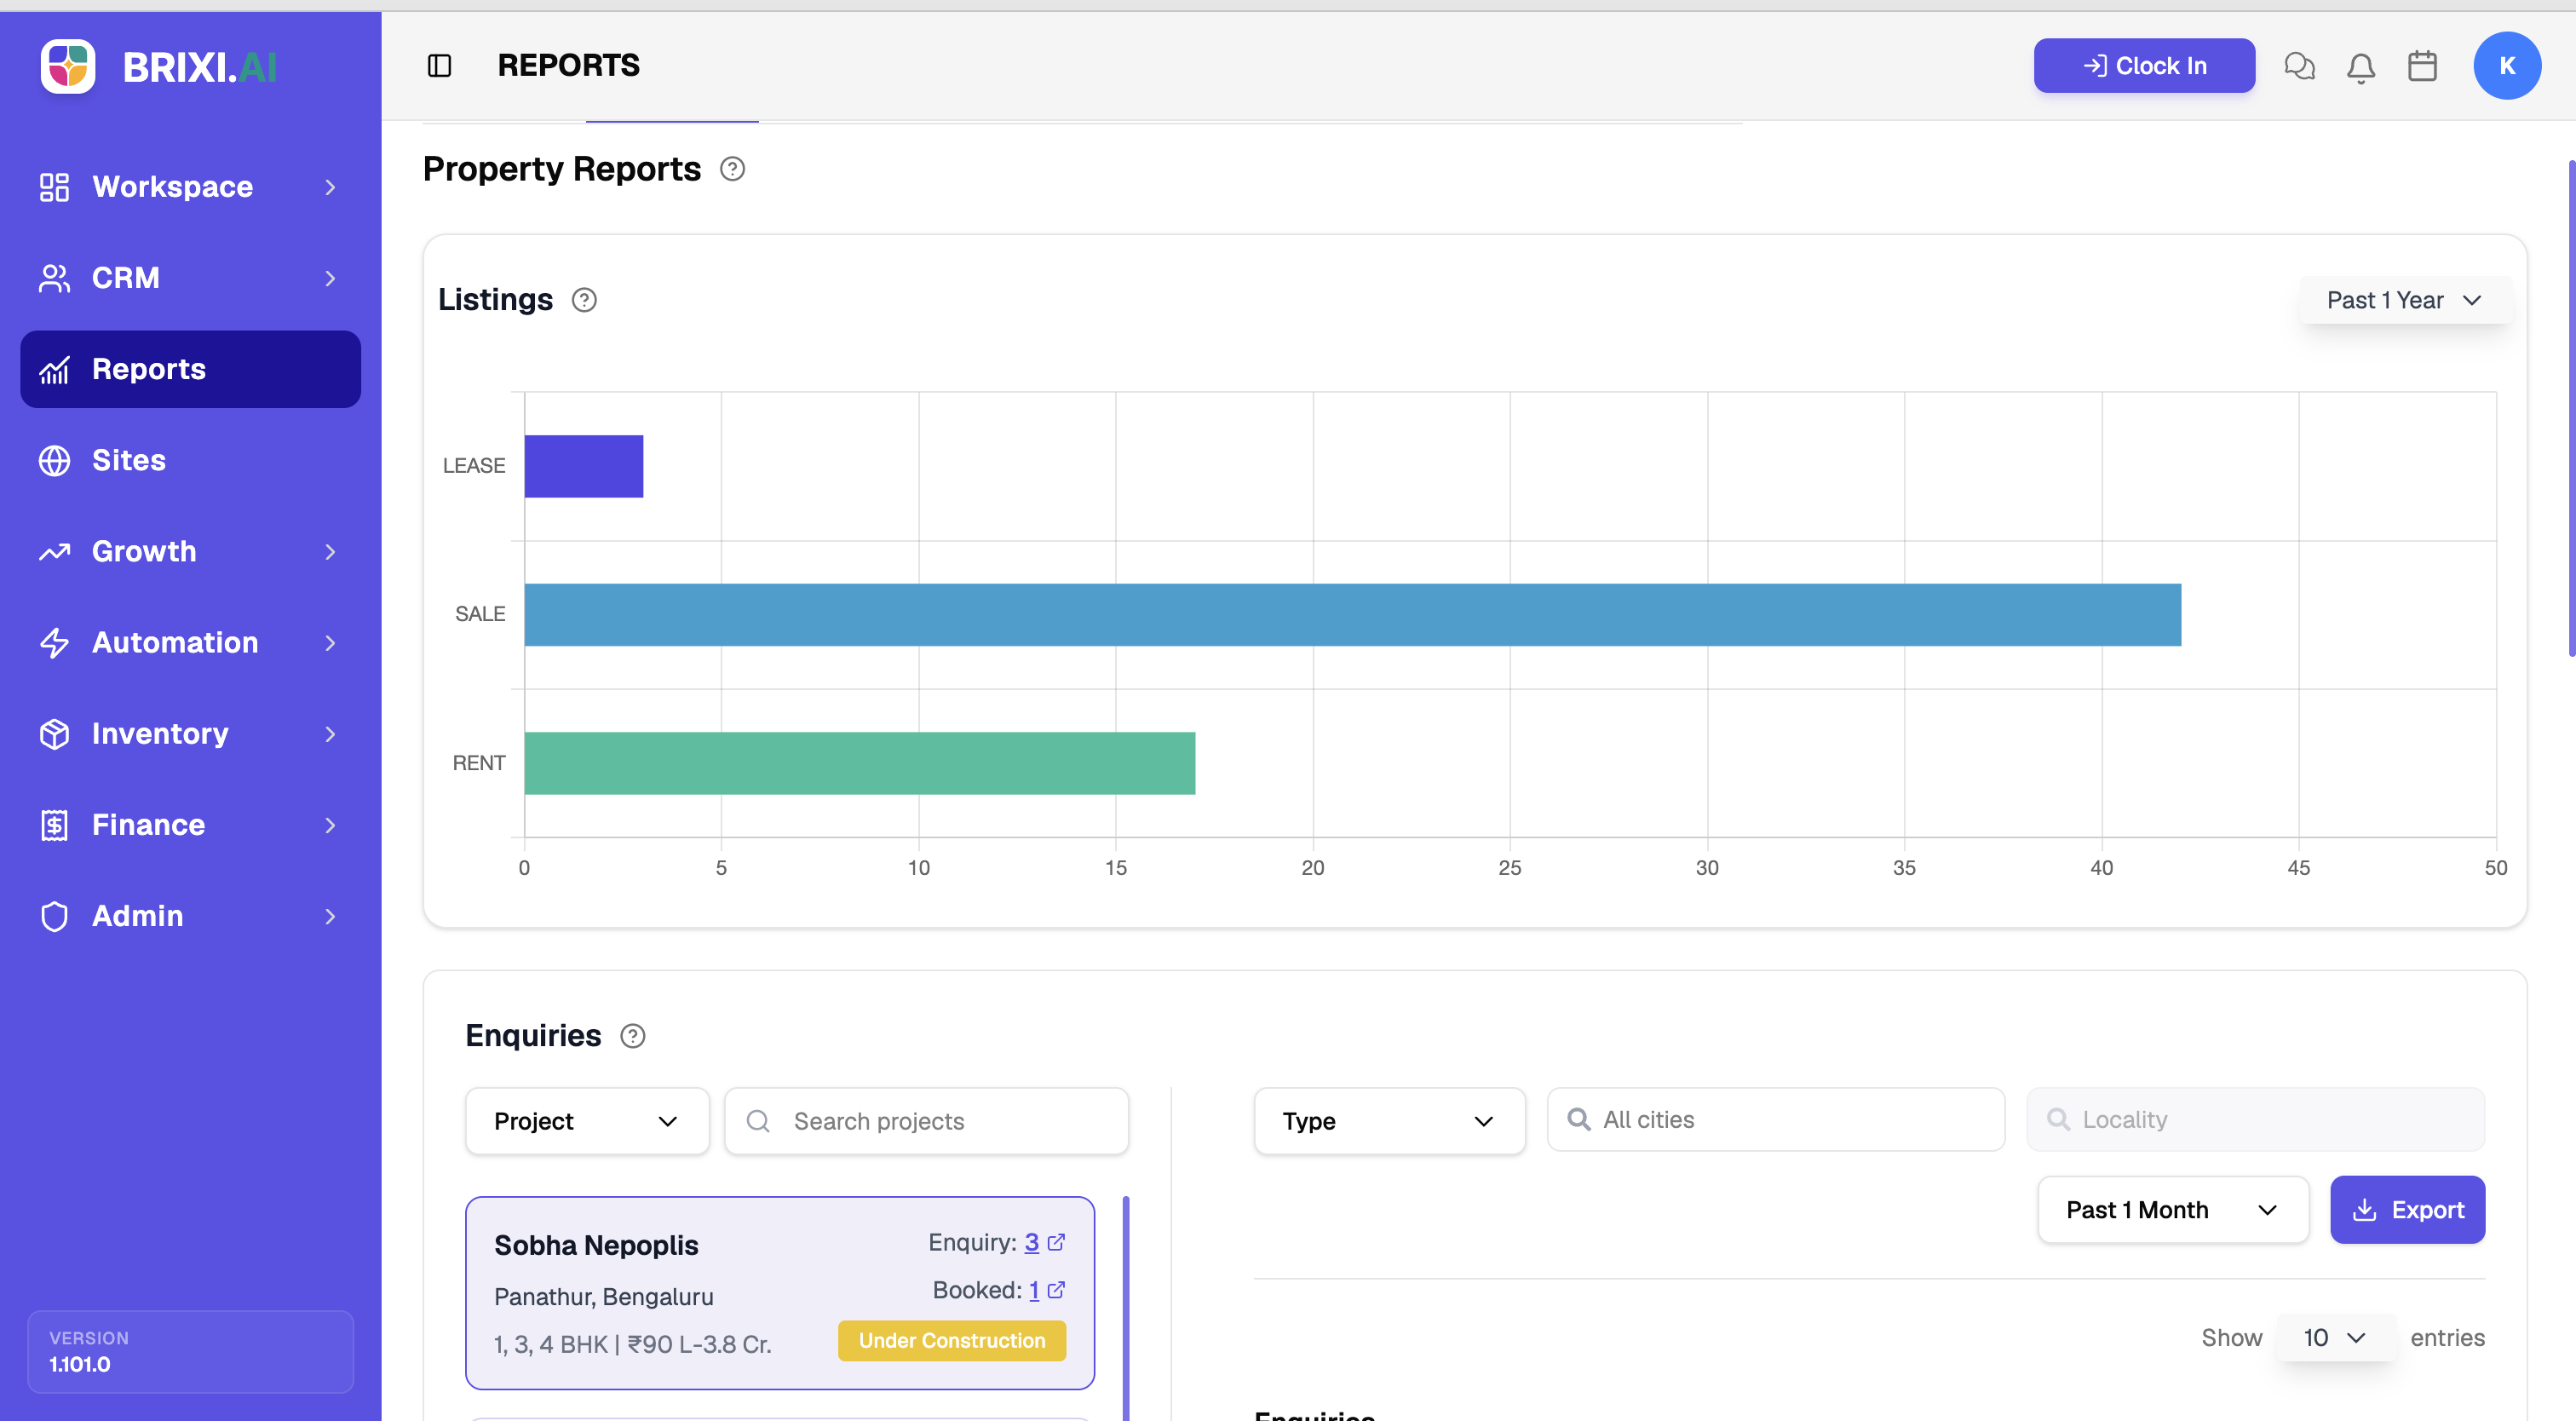
What It Shows
| Section | What it tells you |
|---|---|
| Listings | A bar chart of how many listings are for Sale versus Rent |
| Enquiries | Enquiry activity, filterable by Project, Type, City, and Locality |
Before You Start
- Set the period for the Listings chart.
- For Enquiries, decide whether to filter by Project, Type, City, or Locality.
How To Read It
- Open Reports → Properties.
- Read Listings to compare sale versus rent inventory.
- Scroll to Enquiries and apply the Project, Type, City, or Locality filters to focus on a segment.
- Use Export to download the enquiry data.
Common Issues
| Issue | What to check |
|---|---|
| A listing is missing | Confirm it is posted and not archived in Inventory |
| Enquiries look low | Widen the period and clear the Project or City filters |
If the Properties tab is hidden, or a listing you expected here was never posted to Inventory in the first place, your admin is the right first stop — both come down to access and inventory upkeep.
If the listing counts here genuinely don't match what Inventory shows for the same period, take that to Brixi support with the period, the filters, and a screenshot of both views.
Reporting Impact
The report reads from your live listings and the enquiries against them, so demand analysis is only as reliable as your listing statuses and locations.